Trading Head and Shoulders Reversals (August 2017)

One of the most popular chart patterns in market analysis is “Head and Shoulders” (H&S) pattern. The H&S patterns form near market tops in an established sideways to up trending or bullish markets. The H&S patterns are reversal patterns as they reverse its prior uptrend and follow a bearish or downtrend from its breakdown. These […]
Trading Rectangle Channel Patterns (June 2017)

Rectangle channel patterns consist of two parallel trendlines bounding the price-action having multiple pivot points forming at equal highs and equal lows. As price approaches the lower trendline, bullish sentiment sets to push the price up towards the upper trendline, and when the price reaches the upper trendline, bearish sentiment tends to push the price […]
Patterns within Patterns (May 2017)

Successful pattern trading requires the knowledge of pattern formation, its arrangement, and its market manipulation. Pattern manipulation is achieved when pattern recognition becomes a reflex action for the traders. When a trader is knowledgeable about patterns, it is difficult not to see patterns within other patterns (embedded patterns). The recognition of patterns within patterns and […]
Trading Symmetric Triangle Patterns (Apr. 2017)

Symmetric Triangle is one of the most important chart patterns in technical analysis. These chart patterns form when the market is in an indecision mode where supply/demand is in a state of equilibrium. Even though it is hard to predict (up or downside) the price breakout from this consolidating pattern, they are generally considered to […]
Trading Cup and Handle Patterns (Mar. 2017)

Cup and Handle patterns are continuation patterns, and they usually form in bullish trends. Most Cup and Handle patterns are very reliable and offer great trading opportunities. They also form in all markets and in all time-frames. The “Cup” formation is developed as consolidation phase during price rallies from the round bottom formation over multiple […]
Trading MegaPhone Patterns (Feb. 2017)

Megaphone patterns were first described in Richard Schabacker’s book (1932) “Technical Analysis and Stock Market Profits” as rare and intricate patterns. Megaphone patterns are considered both reversal and continuous patterns and usually appear at the major tops and market bottoms. This pattern may be also called as “Inverted Symmetric Triangle” pattern or “Broadening” pattern and […]
How to trade your Dragon (Jan. 2017)

The bullish Dragon pattern is similar to the ‘W-Bottom’ pattern. Inverse Dragon patterns (Bearish) are similar to ‘M’ patterns. Bullish Dragon patterns usually form at market bottoms and Bearish Dragon patterns form at the market tops. Dragon patterns work in all time frames and all market instruments.Like most ‘Double Bottom’ patterns, Dragon patterns present excellent […]
Trading ABC Patterns by Suri Duddella in Modern Trader Magazine (Dec. 2016)
The ABC Chart pattern and its related AB=CD Chart Pattern are prime examples of “Symmetry” in the markets. These “Harmonic” patterns help traders to identify buying and selling opportunities in all markets and in all time-frames. The ABC and AB=CD patterns are first described by H.M. Gartley in his book “Profits in the Stock Market.” […]
Parabolic Arc: What Goes Up… by Suri Duddella in Modern Trader Magazine (Nov. 2016)
Parabolic Arc chart patterns form when a steep rise in prices caused by irrational buying and intense speculation. Parabolic Arc patterns are rare, but they are reliable and are generated in mega bull trends. These patterns trend gradually making higher highs and lower lows in the beginning stages but can be volatile in the exhaustion […]
Trading Large Gaps
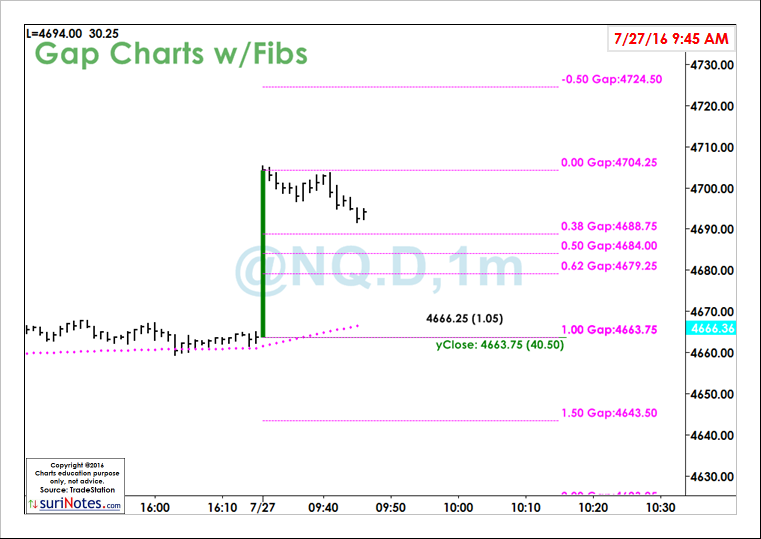
GAPS are overnight moves that occur in all instruments. GAPS are only applicable when measured in Regular Trading Hours (RTH) charts. GAPS phenomena occur mostly at the Opening of a day, usually triggered by an event (Earnings, Mergers, Failures, Major News or some abnormal speculation). Large GAPS happen due to some event influenced by either […]