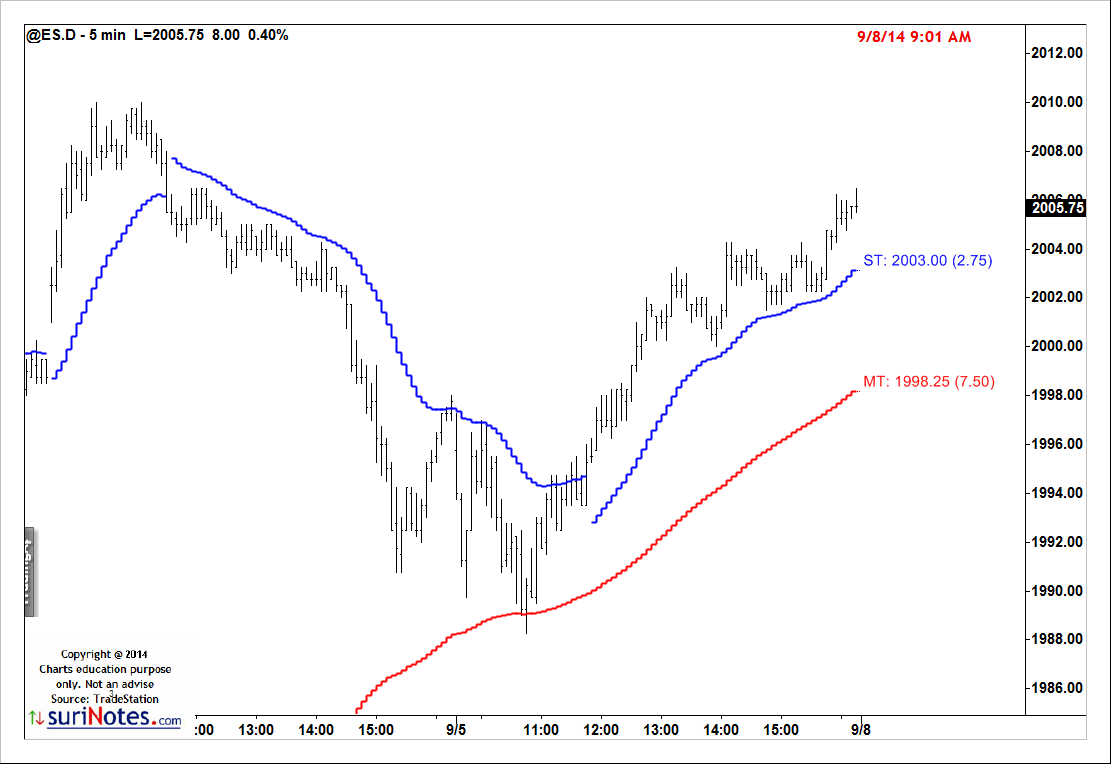
suri.TrailStops shows Dynamic Support and Resistance levels while trailing the Price with ST (Short-Term), MT (Medium Term) and LT (Long-Term) levels. It plots the TrailStops in a ladder display format and flips/switches from Bullish (below) and Bearish (above) Support/Resistance levels and trends. Shows Short-Term, Medium Term, Long Term in both Graphical and RadarScreen with Offsets so you know how far are Stops are from close. You can choose ST, MT and LT optionally and set its colors etc. Can be applied with other indicators, patterns (ABCs, Gartleys etc.) to follow TrailStops