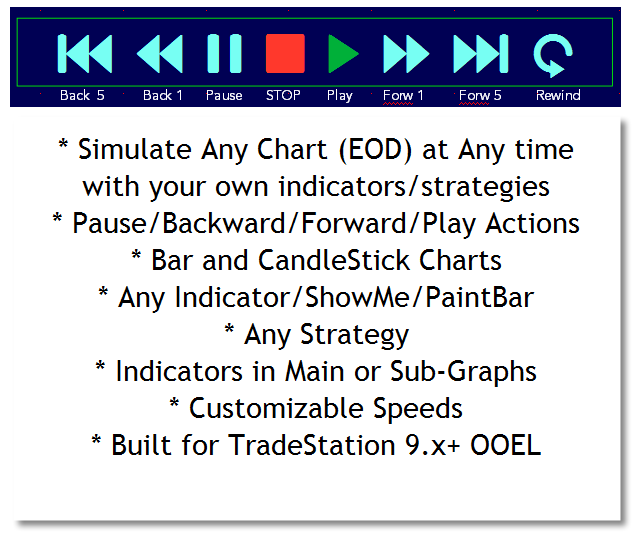
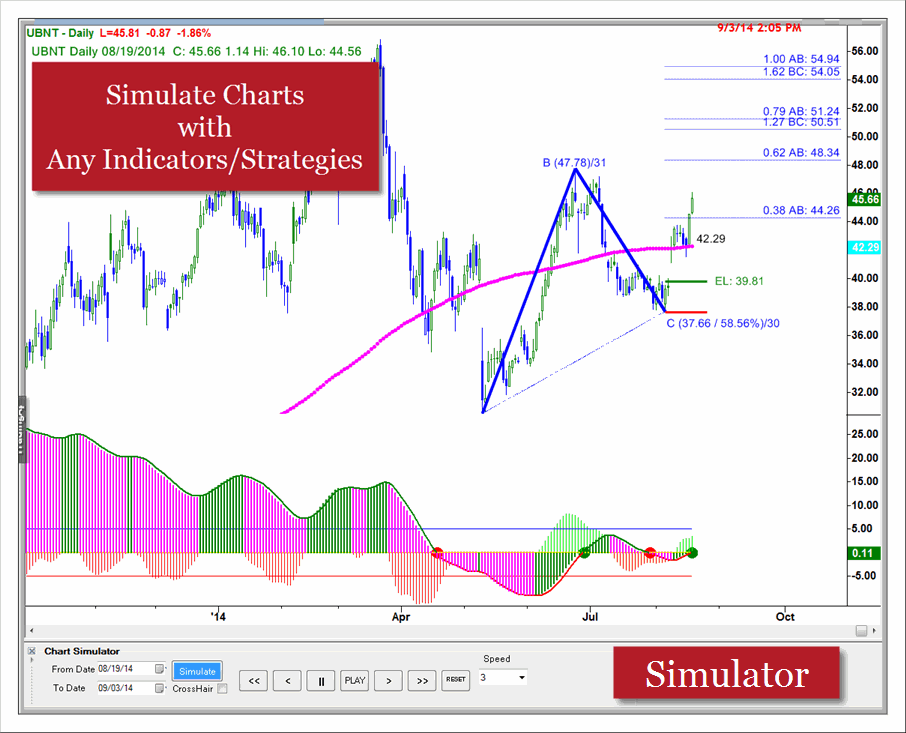
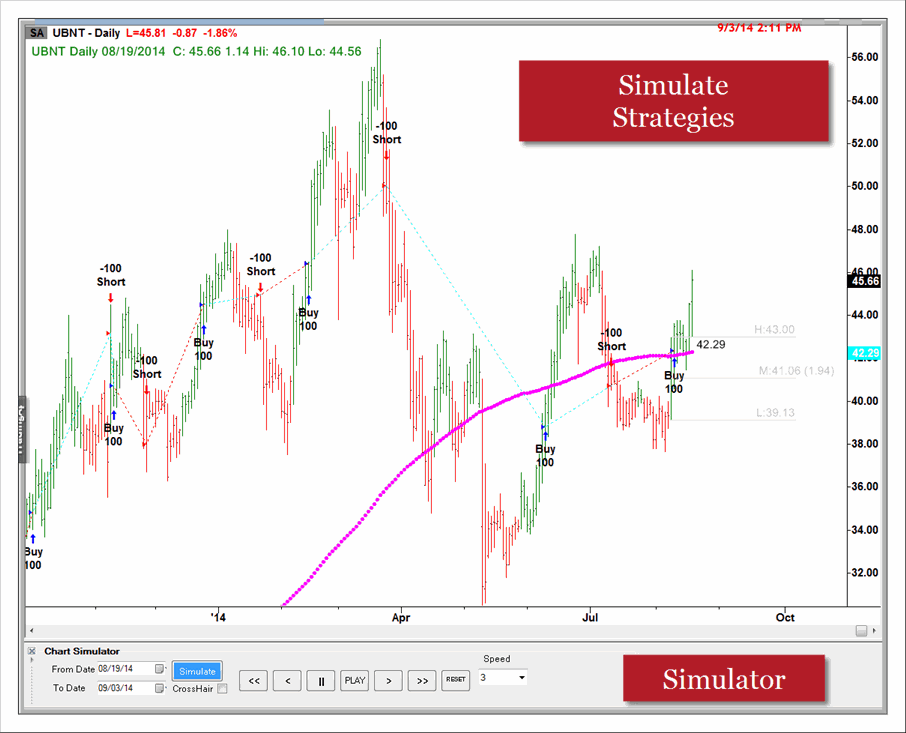
Chart Simulator simulates any chart data (Daily Time-Frame) at any time with indicators/studies/Strageies. It can simulate Bar and Candlestick Chart styles with multiple indicators/studies in main and sub-graphs. Chart data and its indicators can be simulated with Pause/Play/Back or Forward and Rewind functions at user selectable speeds. You can simulate any TS supplied or Self-Builit Indicators/ShowMes/PaintBars and Strageies and 3rd Party indicators. You can pause/backstep/forward step indicator to evaluate how each indicator is forming in multiple sub-graphs.